Filter and rearrange your Style Custom Report
This article guides you on how to get the most value out of working with the Style Custom Report. Columns can be edited, rearranged, and exported to Excel
Introduction & Best Practice
The Style Custom Report is your best way to keep track of data, and the report can be customized to meet your requirements. Once you've created a Style Custom Report, you can actively work within it. Add columns with data points from Style data, custom fields, prices, and sample requests. You can also rearrange columns, filter and edit data, and export the report to Excel for further analysis.
Table of Contents
- Before you start
- Filter the data
- Reorder the columns - set freeze pane
- Copy a Style Custom Report
- Share a Style Custom Report with your colleagues
Before You Start
1) If you need a guide on how to create your first Style Custom Report, then read here
Filter the data
The filter functionality in a Style Custom Report allows you to refine data by applying specific conditions. You can set conditional options to display only the most relevant information based on your needs. There are 3 filters:
Option 1: Conditional Filter
When the data comes from a numeric custom field, a custom field per size or color, or any price field.
- Mouse over the column name and click on the three horizontal lines. You now have these options:

-
Equals / Not Equal – Show or exclude data that matches an exact value.
Example: Filter styles where the "Brand" equals a brand name -
Contains / Does Not Contain – Display entries that include or exclude certain keywords.
Example: Find styles with descriptions containing "denim". -
Less than, Less Than or Equals, Greater than, Greater than or equals – Filter numerical values above or below a threshold.
Example: View styles priced over $50. -
In range – Define a range for values.
Example: Show styles with prices between 50 and 100 EUR. -
Blanc – Identify missing or filled data fields.
Example: Find styles without an assigned supplier. - Choose an option and fill in the
Option 2: Conditional Filter for dates
Whenever the datapoint is a date.
- Mouse over the column name and click on the three horizontal lines. You now have these options:

- Make a selection and select a date from the calendar:

- Click "apply" or add another condition:

- Click "reset" to clear the filter
Option 3: Simple filter
When the data comes from all other sources
- Mouse over the column name and click on the three horizontal lines
- A list of all data points in the column is displayed.
- Deselect "Select all" to clear the filter.
- Either click on the option/options you want to filter on, or start writing in the search field to find the right option
- Click "apply" when you are ready
- A small funnel icon by the column name will indicate that the column has a filter added.
- To clear the filter, click on the three lines again and click "reset"

Reorder the columns, set freeze pane
All columns in your report can be rearranged in different ways:
1. Set Freeze pane/pin the column
- Avoid losing track of the main parameters in your report, such as style name or number, by pinning the column to either the left or right:

- Auto-size one or all culums to the with of the title by choosing "Autosize"
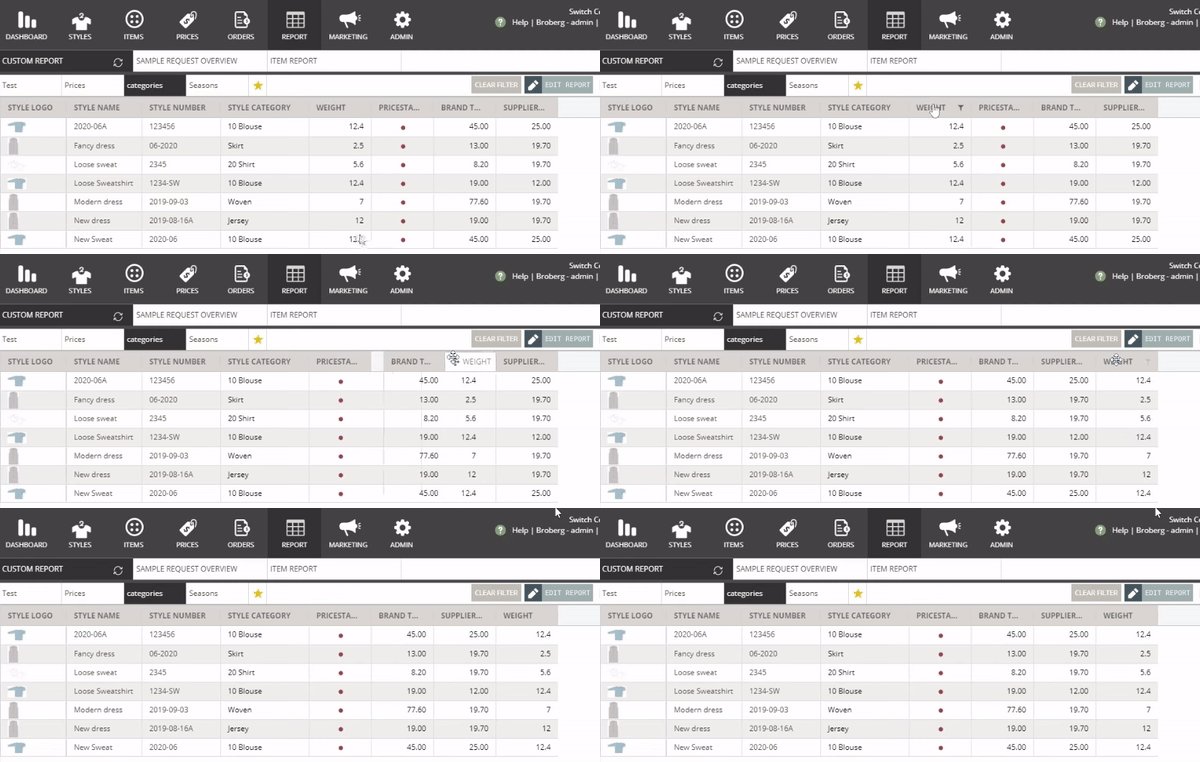
2. Move the column to a new position:
- Simply drag and drop the column to the desired position

- Simply pull the column header to make it wider or slimmer
Copy a Style Custom Report
Once you have made the perfect report, you might want to copy the format for, for example, a new season without having to make the Style Custom Report all over again.
- Mouse over the title of the Style custom report
- Click on the tiny "copy" icon
- Now you get the data set pop-up - here you can change, for example, the season and add a new title for the Style Custom Report


