Introduction & best practice
With this feature, it is possible for you to get an overview of the progress of all your workflows and tasks per style. the overview will show the timeline for each style with the possibility of viewing the progress of each workflow within the style.
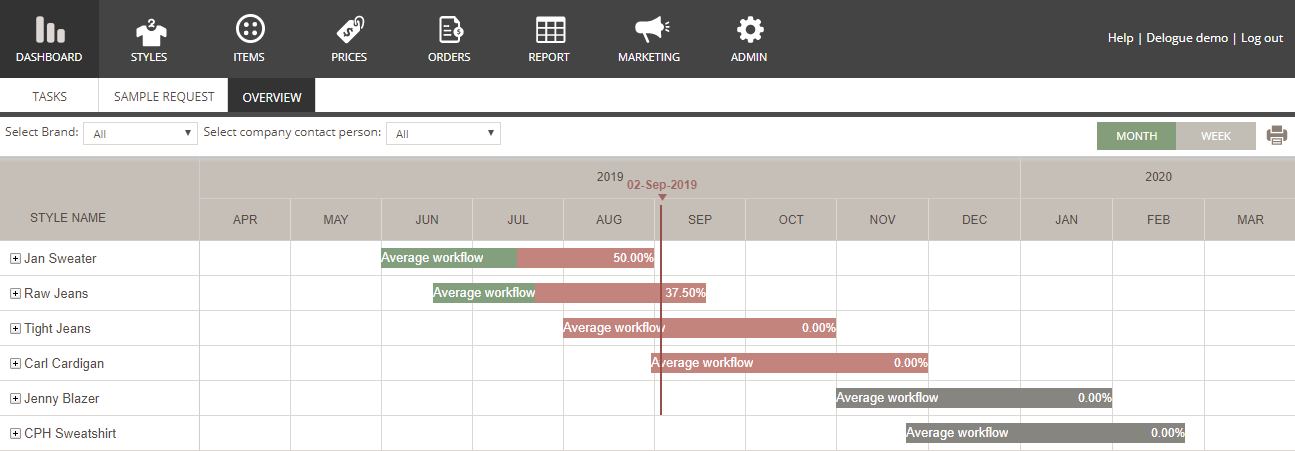
The Overview
The overview can be shown either per month or per week.
By looking at the green and red colors you can see the progress per Style.
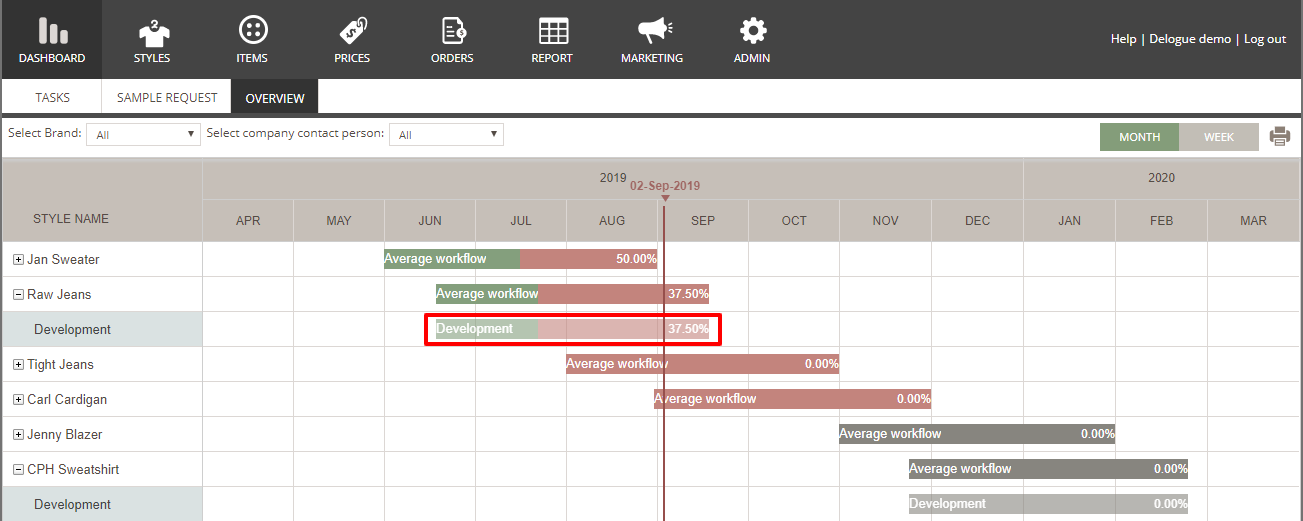
Style details
If you need to view the details about the progress about a specific style, follow these steps:
1. Expand the Style by clicking on the '+' to the left of the style name. This will display all the workflows for the Style in question.
2. Click on the bar (marked with red below) to get a detailed overview of the Tasks in a pop-up window.
3. In the Task pop-up you can see all the Tasks and their progress per Workflow per style.
The colors indicate if a Task is done or not. Green for done and red for not.
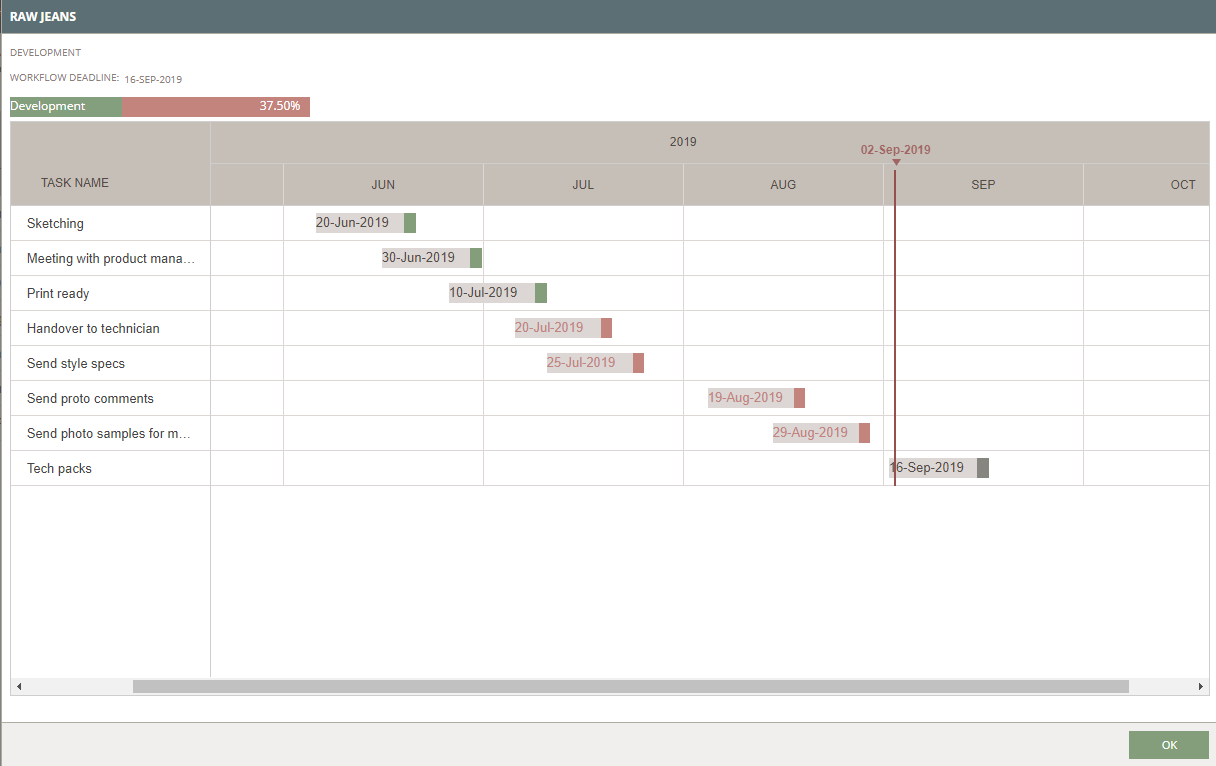
4. You close the pop-up by clicking on"OK"
Filter
You can filter your overview by brand:

And you can filter your overview by brand contact:

