Introduction & best practice
All styles where you are the contact person and where samples have been requested will appear on your dashboard. If you are not the contact person, follow the style using the heart icon, and it will also appear on the dashboard. To find more information how you can follow a style, read here.
Table of contents
- How to use the dashboard
- How to follow a style
- Sample request states
- Bulk updates
- Video guide - Supplier dashboard
How to use the dashboard
The dashboard will give you an overview of all sample requests for the styles that you are the contact person for, and all styles that you are following. To read more on how to follow a style, read below.
Navigate to: Dashboard
- Select the 'Sample Request' subtab
- Find all sample requests listed according to the sample request states (planned, requested, confirmed, sent, received, commented)
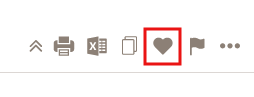
How to follow a style
- Choose the specific style from the style list
- Find the 'heart' icon on the right side of the style header
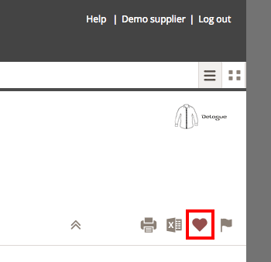
- Once clicked, the heart will turn red - this means you are now following this style
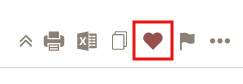
- When you no longer want to follow, click the icon again to make it inactive
Sample request states
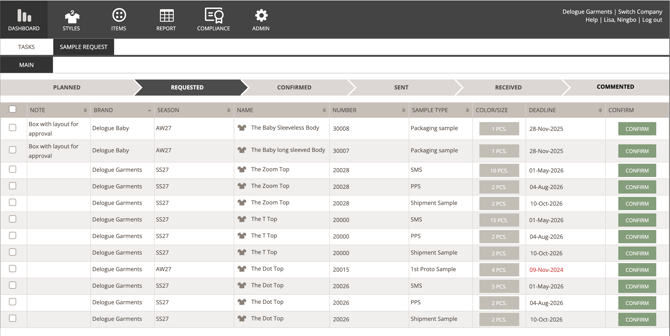
In the Dashboard section, under the Sample Request subtab, you can see all the different states of a specific sample request. Let's have a close look at each state and understand what they mean.
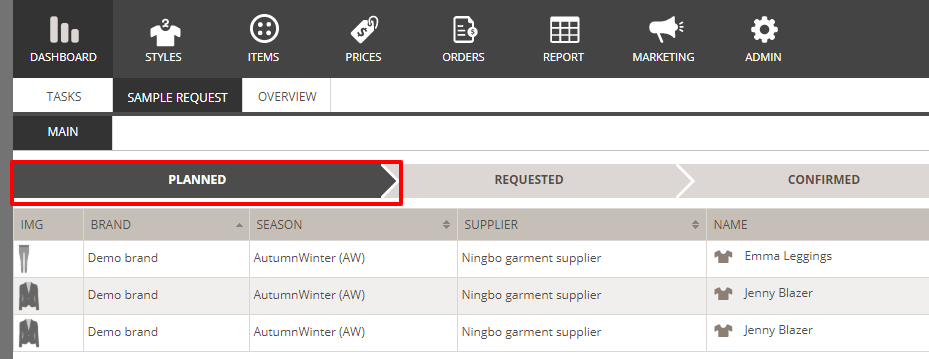
Planned
The 'Planned' state allows the brand users to prepare the sample request and book capacity at your sample production facility. Samples in the state 'Planned' are not meant for you to start developing yet, but they give you an overview of what is planned to come.
Navigate to: Dashboard
- Select the 'Sample Request' subtab
- Click on the tab 'Planned'
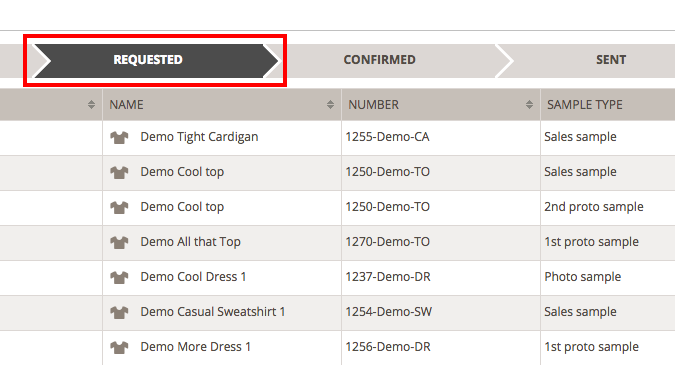
Requested
When the brand changes the state to 'Requested', the sample will appear in the requested tab. This means that the brand wants you to start developing the sample, based on the given deadline.
Navigate to: Dashboard
- Select the 'Sample Request' subtab
- Click on the tab 'Requested'
To check which colours and sizes are requested, do the following:
- Click on the grey button in the 'Color/Size' column
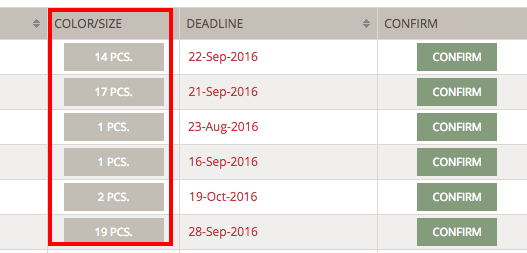
- The pop-up window shows the size and colour of the requested samples

- If everything is as it should be, click the 'Confirm' button to approve the sample request
- If you can not meet the deadline, suggest a new ETD
- Click on the date field
- Fill in a new date
- The ETD date will turn red if it is later than the requested deadline

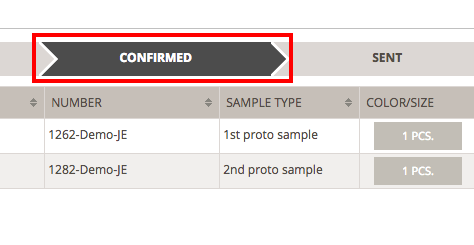
Confirmed
Once you have confirmed the sample request, it will appear under the 'Confirmed' tab.
If the brand can not accept the suggested ETD, they will change or suggest a new ETD, and you will see the adjusted date.
Navigate to: Dashboard
- Select the 'Sample Request' subtab
- Click on the tab 'Confirmed'
- When the sample is ready to be sent, click on the 'Send' button
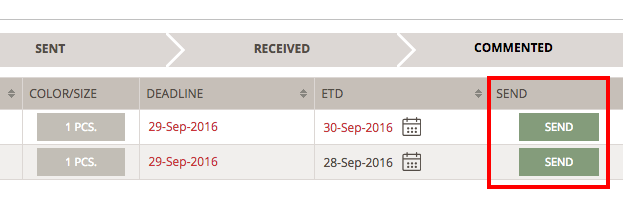
- Enter the tracking number so it is easy for the brand to track and trace the sample
![]()
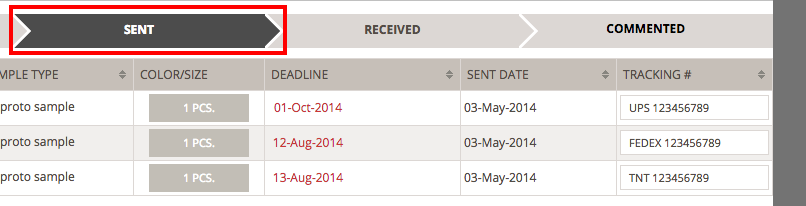
Sent
In the 'Sent' state, you are able to edit and enter the sample tracking number if you forgot to do so when updating the state.
Navigate to: Dashboard
- Select the 'Sample Request' subtab
- Click on the tab 'Sent'
- Enter the tracking number in column 'Tracking'
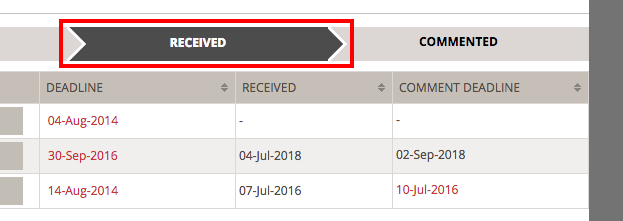
Received
When the sample is received at the brand, the sample request will appear under the 'Received' tab. If you have an agreement with your customer about the deadline for when the sample should be commented, you will see the 'comment deadline' column beside the received date.
Navigate to: Dashboard
- Select the 'Sample Request' subtab
- Click on the tab 'Received'
- View the date in column 'Comment deadline'
Commented
Once the brand has finalised all their sample comments, they will mark the sample as being 'Commented'. You can now see the sample request under the 'Commented' tab. You can print and/or export the sample comments from here.
Navigate to: Dashboard
- Select the 'Sample Request' subtab
- Click on the tab 'Commented'
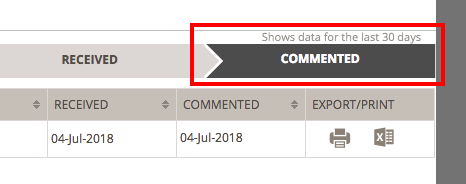
 Click on the 'print' icon to print or download the sample comments as PDF
- Click on the 'Excel' icon to export the data as Excel file
NOTE: You will only see data from the last 90 days.
Bulk updates
To update multiple sample requests with the same information, use the bulk update function. From the Dashboard, you can bulk update the sample request status. To bulk update samples on more information please use the Style Sample Report, read more about it here.
Navigate to: Dashboard
- Select the 'Sample Request' subtab
- Select the sample requests in question by setting a check mark on the very left
- Select status, e.g. change the status from 'Received' to 'Confirmed'
- Click the green 'Update' button to finish

Video Guide - Supplier Dashboard