Introduction & best practice
This article will explain how you can work with the following topics:
- The Style Custom Report - for a better overview of the collection
- The Style Sample Report - for an overview of sample requests and to make bulk actions
- The Sample Request Overview - get an overview of samples on colour/size level
Table of contents
Style Custom Report
The Style Custom Report allows you to make a personalised overview of your samples. You can set up filters to limit the number of samples for each overview. Filter on data points such as Brand, Season or Categories. You can make as many favourite filters as you need.
Create your report
Navigate to: Reports > Style Custom Report
- Click on the big '+' icon or click on the yellow 'star' icon
 to make a second or third Style Custom Report
.png?width=670&height=293&name=Sk%C3%A6rmbillede%202025-01-31%20kl.%2010.04.50%20(1).png)
- Give your report a name
- Set up your filter of style data, including mandatory fields such as 'Brand' and 'Season'
- Optionally, you can add more data points from: Supplier, Group, Categories, Custom Fields, etc
- Styles in the states: 'published', 'unpublished' and 'work in progress' are included by default, add more style states under 'states'
- Click on 'Save' to create your report

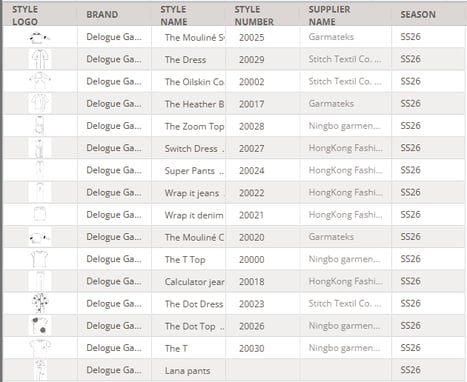
Add columns to your report
- A report is generated with 6 default columns:
- Style Logo
- Brand
- Style Name
- Style Number
- Supplier Name
- Season
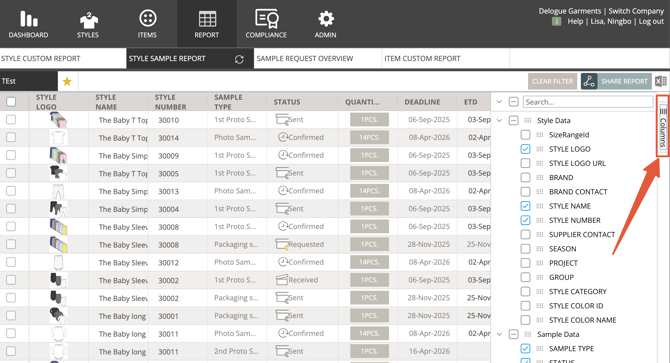
If you want to add more columns, click on 'Columns' on the right-hand side.
- Set a check mark next to all needed data points

- Click on the 'refresh' button to add the new data columns to your report
- Now you can work inside your report
NOTE: As a supplier user, you can create style custom reports, but when choosing columns, only data points you are allowed to see can be selected.
Style sample report
The Style Sample Report allows you to make a personalised overview of your samples and perform bulk actions. Filter on data points such as Brand, Season or Categories. In the Style Sample Report, you will be able to update the data points such as status, ETD and tracking number. You can edit the single sample request line or update multiple sample requests at once by performing bulk actions.
You can make as many favourite filters as you need. You can create the Style Sample Report in the same way as you create the above described style custom report.
Create your report
Navigate to: Reports > Style Sample Report
- Click on the big '+' icon
- Give your report a name
- Set up your filter of style data, including mandatory fields such as 'Brand'
-
By default, a deadline of -30 days and +100 days is selected in your filter, allowing you to only view the most recent samples
-
If you want to view every sample within a specific season, simply remove the deadline filter and select the season instead.
.png?width=553&height=494&name=Sk%C3%A6rmbillede%202025-02-21%20kl.%2011.27.49%20(1).png)
-
Click on 'Save' to create your report
NOTE: If no selection has been made, the report will contain all information. This means that if you do not select, e.g. any style season, then all samples of all seasons will be shown.
Add columns to your report
- A report is generated with 8 default columns:
- Style logo
- Style Name
- Style Number
- Sample Type
- Status
- Quantity
- Deadline
- ETD
If you want to add more columns, click on 'Columns' on the right-hand side.
- Set a check mark next to all needed data points
- Click on the 'refresh' button to add the new data columns to your report
- Now you can work inside your report
Bulk update report data
In the Style Sample Report, you will be able to update the data points such as status, ETD and tracking number. You can edit the single sample request line or update multiple sample requests at once by performing bulk actions.
Navigate to: Reports > Style Sample Report
- Choose the relevant filter or create a new one by clicking on the yellow 'star' icon
- Select the relevant sample requests by setting a check mark next to the sample requests
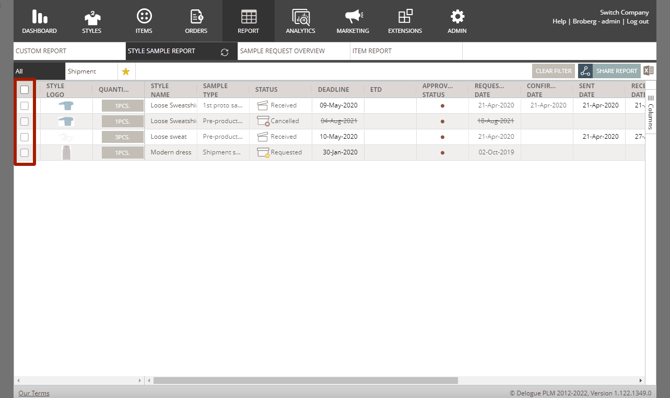
- A bulk update pop-up will appear

- The fields that can be updated are:
- Status
- ETD
- Tracking Number
- Click 'Update' to confirm
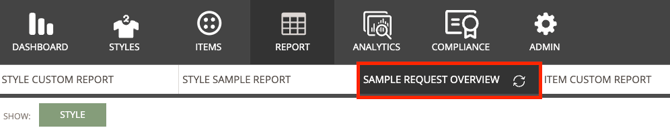
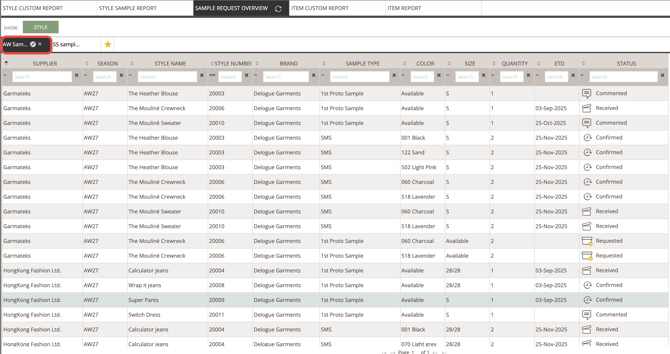
Sample request overview
The Sample Request Overview is a detailed overview of all combinations of colour and size within each sample request.
Create your report
Navigate to: Reports > Sample Request Overview
- Click on the green 'Style' button
- Click on the '+' icon to create your first report, or click on the yellow 'star' icon to add another favourite report filter
.jpg?width=670&height=393&name=SR%20overview%20(1).jpg)
- Give your report a name
- Choose from the drop-down which brand, season, etc. the report should be filtered by

NOTE: If no selection has been made, samples across all seasons, brands etc. will appear.
- Click 'Next'
- Set a check mark next to the data you want to see in your overview
- In column 'Width', write a higher or smaller number if you want the report column to appear wider or more narrow
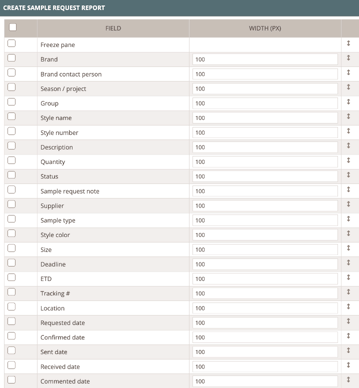
- Adjust their order by dragging and dropping the table rows into the order you want for your report.
- Use the 'Freeze pane' option to freeze columns - this means that the rows placed above the freeze pane will not scroll when you are viewing the report
- Click 'Save' and your report will be ready
- You will see it on the screen, and it will automatically be saved as a favourite
Add columns to your sample request overview
If you want to add more columns to your sample request overview, you can return to the general setup and add more columns.
Navigate to: Report > Sample Request Overview
- Select the favourite filter in question
-
Hover over the favourite filter header
- Click the 'pen' icon to edit the filter
- Click 'next'
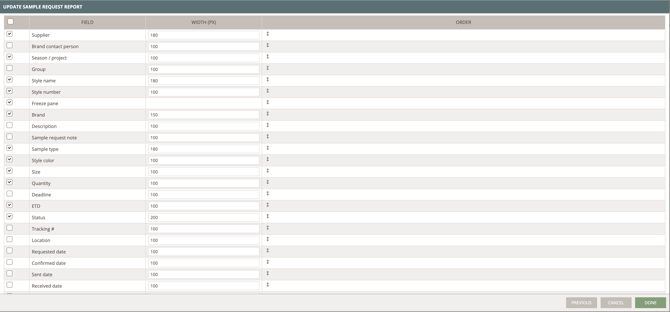
- Set a check mark next to any data field you want to add as a column to your sample request overview
- Click 'done' to finish
Reorder or resize your report
You can change the order of the columns that are displayed in your report. By a simple drag and drop of a column, you can drag it to a new position in your report.
You can also 'pin' the columns you want to have in your freeze pane.

When you create your report, the columns will have a default width, but you can resize columns to fit the data in each column better.
Filter your data
For most columns of your reports, you can apply a filter. There are different types of filters depending on what kind of column it is. If you are already familiar with the filters in the style custom report, these will work the same way.
- Drop-down filter

- Numeric filter

- Date filter

If you want to reset your filter, click on the 'Clear filter' that shows in yellow when a filter is added.

Video guide - Reports
Description
This video gives a short introduction to the following topics:
Style Custom Report
- create a new favourite filter, download and export the report
Style Sample Report
- create a new favourite filter, export the report
Sample Request Overview
- create a new filter, download the report