Introduction & Best Practice
With this Report, you can get an overview of your Sample Requests, filter on sample type, deadline, and much more. You can create and save multiple reports for quick access and you can also export your reports to Excel.
The report will display One row per Style/sample in the combination of color and size. This means that the same sample can be shown multiple times, if the sample request contain more combinations of colors or sizes.
Table of content:
Create a report
Step-by-step
1) Go to the Report section and click 'Sample request overview' from the top bar.
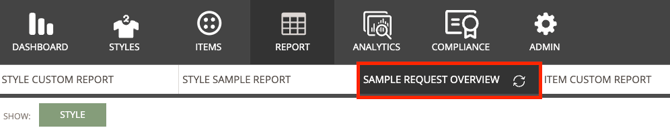
2) Click on 'Style'
3) Click on the 'Plus' to create your first report, or click on the 'Star' to add another favorite report.
.jpg?width=670&height=393&name=SR%20overview%20(1).jpg)
4) Give your report a name - this will be displayed in the your personal favorite report bar.
5) Decide if you want the report to show all style samples or only to show sample requests on styles where you are the contact person or following the style.
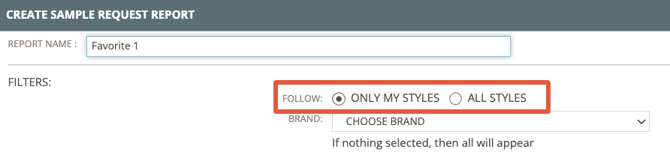
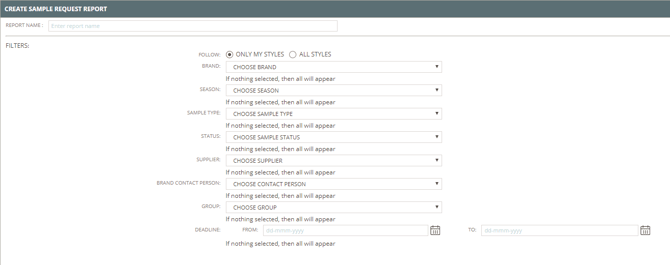
6) Setup your filters/criterias for the report.
NOTE: 'If nothing selected, then all will appear' means that the report will show e.g. all samples across all seasons, if no specific season has been selected.
7) Click 'Next' and select the data you want to see in your overview.
Click the check-box to select one and/or more fields.
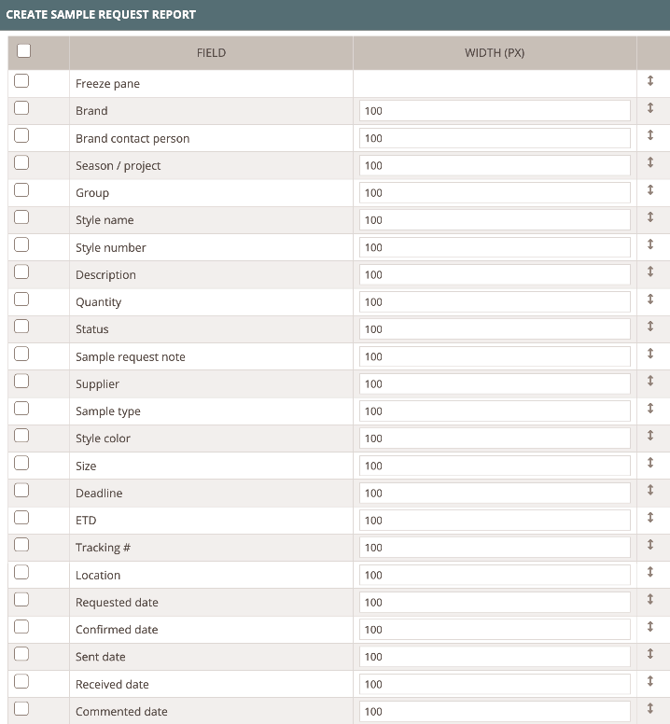
8) Adjust their order by dragging and dropping the table rows into the order you want for your report.
Use the 'Freeze pane' option to freeze columns. This means that the rows placed above the freeze pane will not scroll when you are viewing the report.
NOTE: The 'Width (PX)' will determine the width of the column and can be adjusted by writing a smaller or larger number.
9) When you are done, click 'Save' and your report will be ready! You will see it on the screen and it will automatically be saved as a Favorite.
Filter within your report
Once you have your data on the screen you can filter on each column - if you are looking for something specific.
For each column you can filter on:
- 'contains'
- 'equals'
- 'begins with'
1) Enter the value you want to search for
2) Click enter - then the data matching will be displayed.
Export you report to Excel
If you need it you can always export any of your saved reports to Excel.
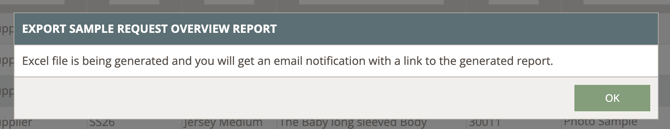
1) Select the favorite you need and then click on the Excel button.

2) The report will be generated and an email notification will be sent to your email inbox, once ready.
Making Sample request Overview as a supplier
Supplier users can create this report too.
But Supplier users will only see the sample requests where they are selected as the supplier.
They will not be able to see any other data.
INFO: If you are a supplier user and what to learn more about how to make the Sample Request Overview, follow this link.
