Introduction & Best practice
If you haven't created your Style Sample Report yet - start by following this guide.
Once you have created your Style Sample Report with its default columns, you might need more columns to get the correct data. Or you might want to sort or filter your data in a specific way.
In this article you will learn how to make ensure that the report meets you needs.
Table of Content
Add more columns to your report
If you want to add more data to your report or remove any of the default columns to create the perfect report - follow these steps.
1. Click on the column selector on the right side called 'Columns'.
2. In the column selector, you can select both Style data and Sample data.
You can select as many columns as you need.
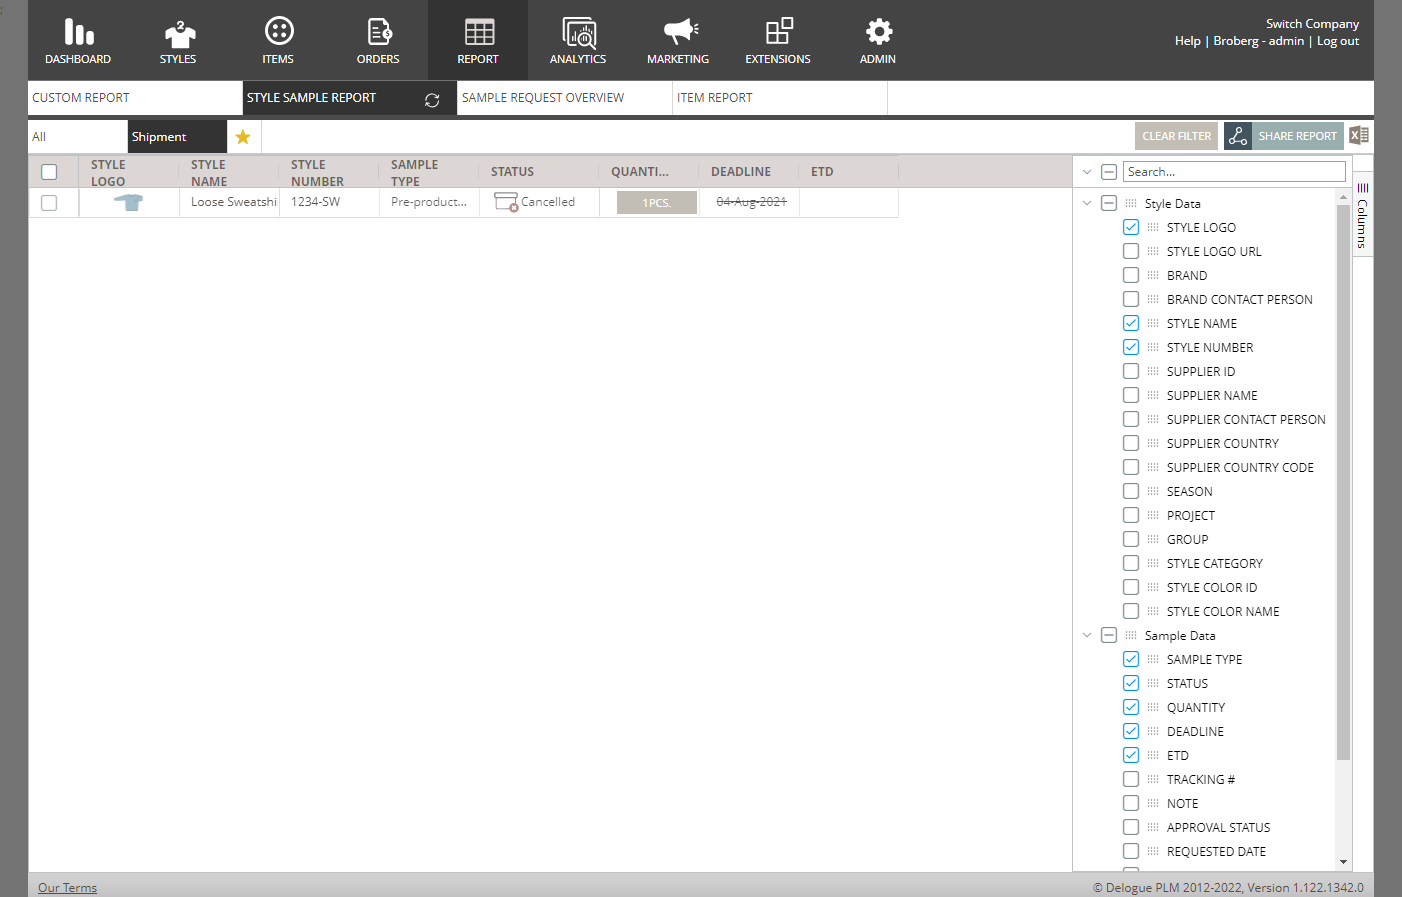
Supplier users can only select the data columns that they are allowed to see.
Filter your data
For most columns in your Style Sample Report, you can apply a filter.
There are different types of filters depending on what kind of column it is.
If you are already familiar with the filters in the Custom Report these will work the same way.
- Drop-down filter

- Numeric filter

- Date filter

If you want to reset your filter, simply click on the 'Clear filter' that show in the yellow when a filter is added.

Reorder or resize your report
You can change the order of the columns that are displayed in your report.
By a simple drag and drop of a column, you can drag it to a new position in your report.
You can also 'pin' the columns you want to have in your freeze pane.

When you create your Report the columns will have default width but you can change this to fit the data in each column better.

Next steps:
