To use this feature, your company must have the PRO license subscription
If you are used to Pivot in Excel, then you will find this very similar.
In this article we will explain how to:
- Organising data
- Visualise your data
- Export
- Average values
- Formatting values
- Conditional formatting of values
- Create new calculations
- Share a favourite
- Receive a shared favourite
Organising data
Create favourite
First of all, you need to select the data you want to appear in your favourite.
- Click on the star to create a favourite.
- Name the favourite
- Select the seasons you want to compare style data.
- Click ok.
Style data will appear by default, divided by season/category.
You can change this by selecting data as described below.
Select data
You can change columns and rows by clicking the "Fields" button.
- Use the search field to find the option you want to include
- Drag and drop it to either:
- report filter (used for filtering data)
- rows /columns
- value (either count or sum of value)
Save setting
Each time you make changes, a green save button will appear in the favourite tab.
Make sure to click save, if you want to keep your changes for next time.
Visualise your data
You can present data in different charts.
- Select a chart and choose the chart you want to have
Export
You can export both the grid and the charts in different formats.
Average values
In this module, you can also get the average values presented.
This is, for example, useful when looking at margins.
- Go to fields and search for a numeric option (for example, Mark up)
- Drag it to Values
- Change from "Sum" to "Average"

Formatting values
In case too many digits appear, you can select "Format" and define the number of digits you want to appear.
Conditional formatting of values
Let's say you want to highlight values above or below a certain amount, then you can use Conditional formatting.
In this case, I want to highlight Mark Up values less than 3.
Create new calculations
For all the numeric fields in Delogue PLM you can create Calculations.
In this example, I want to calculate an expected turnover by multiplying Expected Quantity and Wholesale Price.
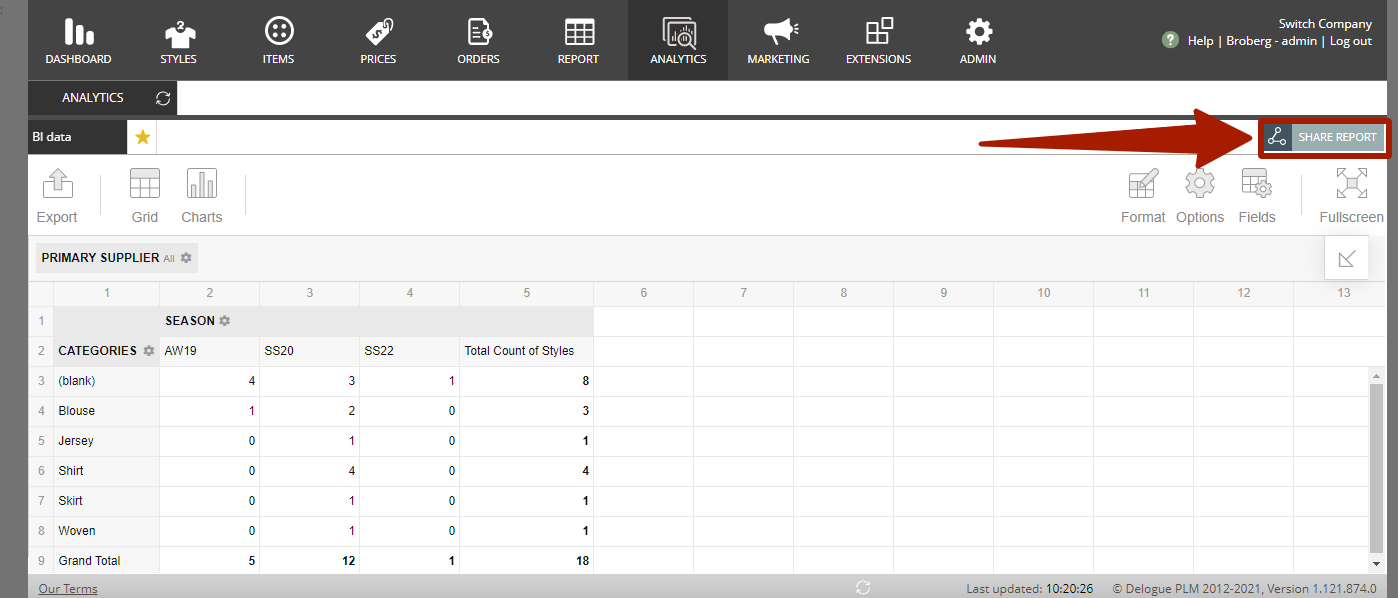
Share a favourite
When you have set up the perfect Analytics report, you might want to share it with others so they have access to the same setup.
You can easily share a saved favourite with your colleagues.
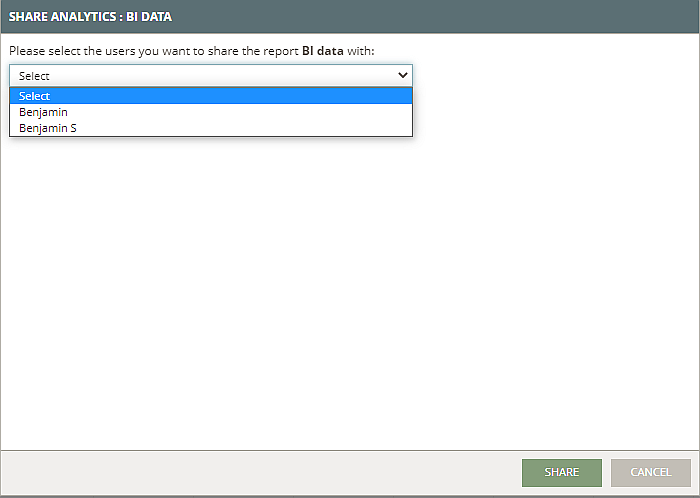
Simply select the favourite you want to share, then click on the "Share Report" button
Now you will get a pop-up where you can select the users you want to share your favourite with.
Receive a shared favourite
When you receive a Share Analytics favourite, it will be added to all your other favourites.
You can decide what to do with it. You can choose to edit it, rename it or delete it.
Important:
It is important to remember that whatever changes the Receiver makes on his copy of the shared Favourite has no influence on the original Favourite.